The Damp and Mould Risk Index
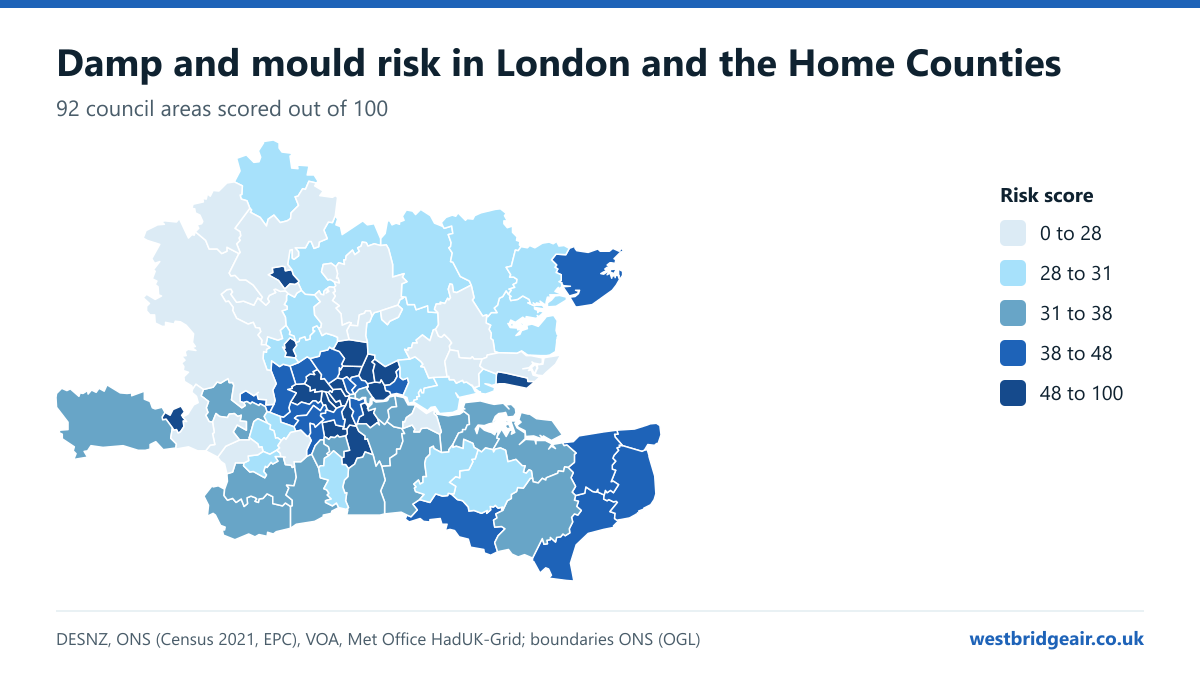
Kensington and Chelsea has the highest damp and mould risk of all 92 council areas in London and the Home Counties, followed by Haringey and Westminster. Outside London, Luton comes top. Our index scores every area out of 100 from seven open measures: old housing, energy ratings, fuel poverty, private renting, overcrowding, homes without central heating and winter rainfall.
Last updated 2026-11-01.
What the index shows
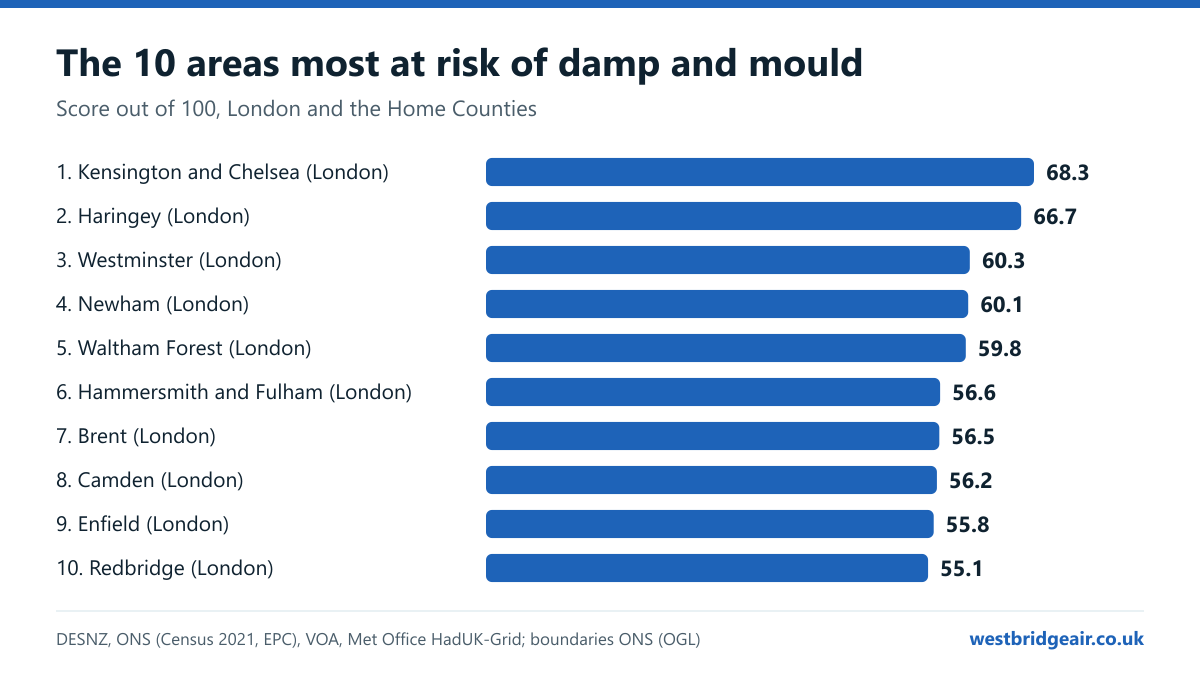
- The ten highest-risk areas are Kensington and Chelsea, Haringey, Westminster, Newham, Waltham Forest, Hammersmith and Fulham, Brent, Camden, Enfield and Redbridge. All ten are London boroughs.
- Luton (Bedfordshire) is the highest-risk area outside London, ranked 12 of 92, ahead of Southend-on-Sea and Watford.
- In the ten highest-risk areas, 35% of households rent privately and 13% are short of a bedroom. In the ten lowest-risk areas, it's 15% and 4%.
- 43% of homes in the ten highest-risk areas were built before 1919, against 5% in the ten lowest.
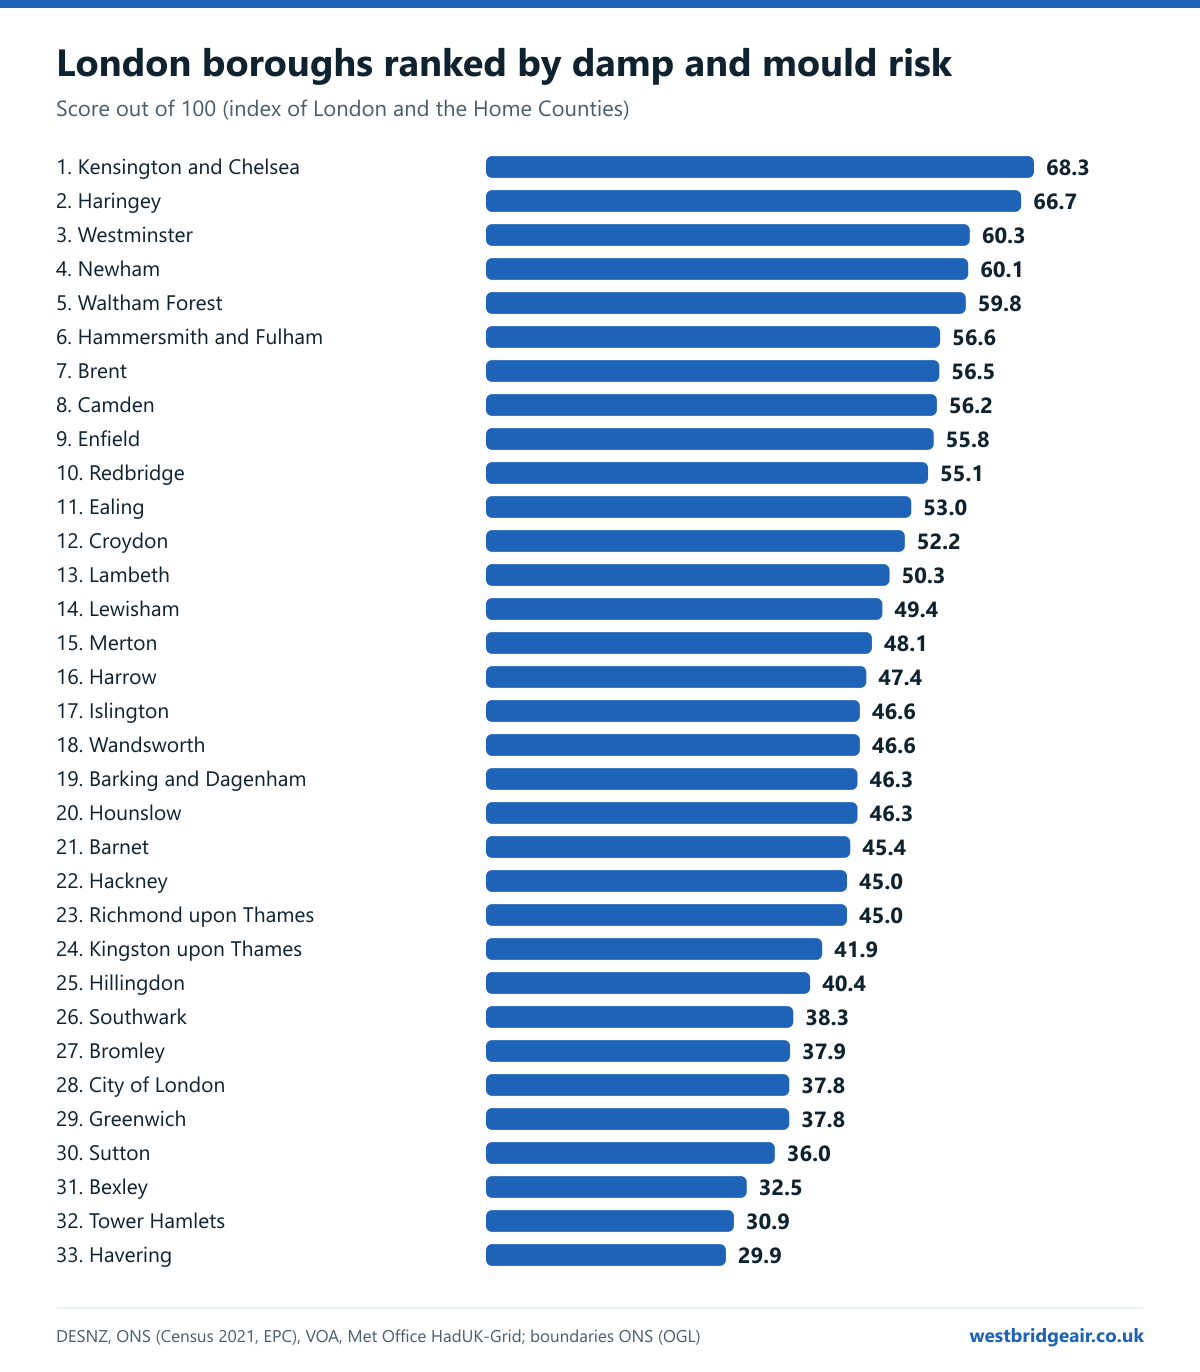
- The lowest risk in the index is in Wokingham, then Bracknell Forest. In London, Havering scores lowest.
Map: damp and mould hotspots in London and the Home Counties
London close up
The 10 areas most at risk of damp and mould
- 1Kensington and Chelsea · London68.3
- 2Haringey · London66.7
- 3Westminster · London60.3
- 4Newham · London60.1
- 5Waltham Forest · London59.8
- 6Hammersmith and Fulham · London56.6
- 7Brent · London56.5
- 8Camden · London56.2
- 9Enfield · London55.8
- 10Redbridge · London55.1
Search your area: every council ranked
92 of 92 areas shown. Rank 1 is the highest risk.
| Rank | Area | Score | Pre-1919 | Below EPC C | Fuel poverty | Private rented | Overcrowded | No central heating | Winter rain |
|---|---|---|---|---|---|---|---|---|---|
| 1 | Kensington and ChelseaLondon | 68.3 | 64.6% | 48.6% | 10.7% | 39.6% | 8.1% | 3.4% | 163.3 mm |
| 2 | HaringeyLondon | 66.7 | 53.7% | 47.7% | 11.4% | 35.6% | 13.5% | 2.3% | 174.2 mm |
| 3 | WestminsterLondon | 60.3 | 48.4% | 36.3% | 10.2% | 43.3% | 10.2% | 3.9% | 166.7 mm |
| 4 | NewhamLondon | 60.1 | 36.6% | 32.8% | 11.9% | 38.5% | 21.5% | 2.5% | 151.9 mm |
| 5 | Waltham ForestLondon | 59.8 | 44.6% | 47.7% | 11.5% | 27.8% | 13.4% | 2.1% | 164.5 mm |
| 6 | Hammersmith and FulhamLondon | 56.6 | 54.9% | 39.6% | 9.7% | 36.4% | 9.1% | 2.5% | 163.7 mm |
| 7 | BrentLondon | 56.5 | 27.7% | 38.0% | 11.4% | 36.0% | 16.9% | 2.2% | 177.4 mm |
| 8 | CamdenLondon | 56.2 | 48.1% | 40.9% | 9.6% | 35.6% | 9.5% | 2.8% | 177.0 mm |
| 9 | EnfieldLondon | 55.8 | 23.2% | 54.3% | 11.0% | 29.3% | 12.9% | 2.1% | 177.5 mm |
| 10 | RedbridgeLondon | 55.1 | 26.7% | 53.7% | 10.7% | 30.4% | 13.1% | 2.1% | 162.6 mm |
| 11 | EalingLondon | 53.0 | 27.9% | 42.2% | 10.7% | 34.0% | 13.2% | 2.1% | 171.2 mm |
| 12 | LutonBedfordshire | 52.5 | 13.0% | 49.9% | 12.0% | 29.0% | 12.2% | 1.8% | 175.8 mm |
| 13 | CroydonLondon | 52.2 | 28.2% | 48.5% | 10.0% | 25.8% | 10.4% | 2.0% | 209.1 mm |
| 14 | Southend-on-SeaEssex | 50.3 | 27.1% | 62.5% | 11.0% | 26.5% | 4.2% | 1.4% | 135.4 mm |
| 15 | LambethLondon | 50.3 | 39.6% | 42.3% | 9.3% | 31.4% | 10.6% | 2.6% | 159.6 mm |
| 16 | LewishamLondon | 49.4 | 34.2% | 44.0% | 9.8% | 27.2% | 11.4% | 2.4% | 163.1 mm |
| 17 | WatfordHertfordshire | 48.2 | 22.3% | 42.3% | 10.8% | 28.2% | 8.7% | 1.8% | 190.2 mm |
| 18 | MertonLondon | 48.1 | 26.4% | 47.7% | 9.9% | 29.1% | 9.4% | 2.0% | 165.9 mm |
| 19 | ReadingBerkshire | 48.1 | 24.2% | 45.1% | 10.0% | 31.9% | 7.1% | 2.1% | 181.3 mm |
| 20 | ThanetKent | 48.0 | 31.8% | 52.1% | 10.4% | 26.3% | 3.7% | 1.5% | 162.0 mm |
| 21 | Tunbridge WellsKent | 47.5 | 33.5% | 50.7% | 9.3% | 19.2% | 2.9% | 1.3% | 234.9 mm |
| 22 | HarrowLondon | 47.4 | 10.2% | 49.5% | 10.4% | 29.6% | 12.2% | 1.4% | 184.9 mm |
| 23 | Folkestone and HytheKent | 47.3 | 27.7% | 48.8% | 9.8% | 22.5% | 3.1% | 1.5% | 226.0 mm |
| 24 | IslingtonLondon | 46.6 | 43.1% | 36.8% | 8.5% | 31.2% | 9.4% | 2.4% | 166.9 mm |
| 25 | WandsworthLondon | 46.6 | 43.0% | 36.9% | 8.5% | 36.3% | 7.5% | 2.1% | 160.0 mm |
| 26 | Barking and DagenhamLondon | 46.3 | 4.0% | 37.3% | 12.8% | 24.2% | 17.8% | 2.2% | 152.6 mm |
| 27 | HounslowLondon | 46.3 | 16.2% | 39.5% | 10.3% | 30.9% | 14.6% | 2.2% | 166.0 mm |
| 28 | DoverKent | 46.0 | 29.0% | 47.2% | 10.2% | 19.0% | 3.1% | 1.3% | 221.2 mm |
| 29 | BarnetLondon | 45.4 | 19.7% | 41.8% | 9.4% | 32.7% | 9.4% | 1.9% | 188.7 mm |
| 30 | HackneyLondon | 45.0 | 34.8% | 31.6% | 9.0% | 32.2% | 12.7% | 2.7% | 158.6 mm |
| 31 | Richmond upon ThamesLondon | 45.0 | 37.7% | 55.1% | 8.3% | 24.7% | 4.0% | 1.5% | 165.0 mm |
| 32 | Kingston upon ThamesLondon | 41.9 | 21.0% | 50.8% | 8.6% | 27.3% | 6.0% | 1.8% | 171.8 mm |
| 33 | SloughBerkshire | 41.7 | 5.2% | 38.9% | 9.8% | 30.7% | 15.8% | 2.0% | 169.4 mm |
| 34 | HillingdonLondon | 40.4 | 4.4% | 48.9% | 9.5% | 25.9% | 11.3% | 1.6% | 175.1 mm |
| 35 | TendringEssex | 39.9 | 14.0% | 54.8% | 10.9% | 19.8% | 2.5% | 1.4% | 143.5 mm |
| 36 | CanterburyKent | 39.2 | 18.0% | 47.9% | 9.2% | 22.0% | 3.1% | 1.2% | 199.2 mm |
| 37 | SouthwarkLondon | 38.3 | 24.5% | 30.7% | 8.2% | 28.7% | 12.2% | 3.1% | 160.7 mm |
| 38 | BromleyLondon | 37.9 | 17.0% | 55.8% | 7.9% | 17.4% | 4.5% | 1.3% | 202.9 mm |
| 39 | GraveshamKent | 37.9 | 19.3% | 47.4% | 9.3% | 19.1% | 6.0% | 1.5% | 168.5 mm |
| 40 | City of LondonLondon | 37.8 | 21.6% | 32.9% | 6.3% | 48.3% | 4.7% | 3.7% | 157.8 mm |
| 41 | GreenwichLondon | 37.8 | 21.8% | 34.6% | 9.2% | 25.5% | 10.7% | 2.1% | 155.0 mm |
| 42 | SevenoaksKent | 37.0 | 18.6% | 54.9% | 8.1% | 13.4% | 2.5% | 1.0% | 220.2 mm |
| 43 | WaverleySurrey | 37.0 | 20.9% | 48.4% | 7.9% | 14.7% | 1.9% | 0.7% | 252.4 mm |
| 44 | GuildfordSurrey | 36.9 | 15.7% | 49.0% | 8.3% | 19.6% | 3.0% | 1.0% | 220.2 mm |
| 45 | Mole ValleySurrey | 36.8 | 17.5% | 53.0% | 7.7% | 14.1% | 2.3% | 1.0% | 241.6 mm |
| 46 | MedwayKent | 36.4 | 19.5% | 48.0% | 8.9% | 20.2% | 4.5% | 1.7% | 160.9 mm |
| 47 | SuttonLondon | 36.0 | 13.1% | 48.2% | 8.1% | 20.3% | 7.2% | 1.8% | 186.1 mm |
| 48 | TandridgeSurrey | 35.4 | 17.7% | 51.1% | 7.5% | 13.3% | 2.8% | 0.9% | 242.6 mm |
| 49 | SwaleKent | 35.0 | 19.7% | 45.4% | 8.7% | 18.4% | 4.0% | 1.6% | 175.2 mm |
| 50 | West BerkshireBerkshire | 32.6 | 13.7% | 47.6% | 7.9% | 17.1% | 2.3% | 1.0% | 212.4 mm |
| 51 | BexleyLondon | 32.5 | 10.8% | 55.3% | 7.9% | 15.3% | 6.1% | 1.7% | 158.1 mm |
| 52 | AshfordKent | 32.2 | 16.2% | 38.8% | 8.1% | 17.7% | 3.4% | 1.2% | 220.7 mm |
| 53 | Windsor and MaidenheadBerkshire | 31.7 | 17.0% | 46.7% | 7.6% | 20.6% | 3.4% | 1.1% | 179.1 mm |
| 54 | Epsom and EwellSurrey | 31.4 | 9.5% | 52.7% | 7.6% | 16.1% | 3.6% | 1.1% | 194.0 mm |
| 55 | Tower HamletsLondon | 30.9 | 11.7% | 17.8% | 7.0% | 38.2% | 15.9% | 3.1% | 155.3 mm |
| 56 | BedfordBedfordshire | 30.8 | 17.2% | 39.1% | 9.3% | 19.1% | 4.2% | 1.2% | 148.9 mm |
| 57 | MaidstoneKent | 30.8 | 17.2% | 39.8% | 8.0% | 17.3% | 3.4% | 1.2% | 201.6 mm |
| 58 | Epping ForestEssex | 30.3 | 10.7% | 50.8% | 8.3% | 14.9% | 4.0% | 1.2% | 164.3 mm |
| 59 | HaveringLondon | 29.9 | 4.9% | 56.3% | 7.8% | 15.8% | 6.0% | 1.4% | 151.9 mm |
| 60 | MaldonEssex | 29.8 | 14.9% | 50.1% | 9.3% | 11.8% | 1.9% | 1.3% | 139.4 mm |
| 61 | HertsmereHertfordshire | 29.3 | 7.0% | 44.9% | 8.2% | 17.3% | 5.2% | 1.0% | 184.1 mm |
| 62 | UttlesfordEssex | 28.9 | 19.1% | 40.1% | 9.3% | 14.5% | 1.4% | 0.9% | 158.2 mm |
| 63 | St AlbansHertfordshire | 28.8 | 13.6% | 45.7% | 7.7% | 16.3% | 3.1% | 0.8% | 186.4 mm |
| 64 | SpelthorneSurrey | 28.8 | 8.0% | 48.5% | 7.5% | 17.9% | 5.1% | 1.4% | 169.7 mm |
| 65 | Reigate and BansteadSurrey | 28.7 | 13.8% | 41.8% | 6.7% | 15.7% | 3.6% | 0.9% | 233.4 mm |
| 66 | North HertfordshireHertfordshire | 28.6 | 14.7% | 44.2% | 8.7% | 15.4% | 2.2% | 1.0% | 160.8 mm |
| 67 | ThurrockEssex | 28.5 | 6.6% | 45.7% | 8.2% | 18.3% | 6.8% | 1.8% | 143.4 mm |
| 68 | Castle PointEssex | 28.5 | 1.8% | 66.6% | 7.6% | 14.0% | 2.7% | 1.1% | 137.0 mm |
| 69 | RunnymedeSurrey | 28.5 | 12.4% | 44.7% | 7.3% | 19.1% | 3.6% | 1.3% | 179.9 mm |
| 70 | WokingSurrey | 28.2 | 10.6% | 43.0% | 6.9% | 21.1% | 4.3% | 1.5% | 186.8 mm |
| 71 | BraintreeEssex | 28.1 | 13.4% | 41.4% | 9.3% | 15.1% | 2.3% | 1.1% | 152.9 mm |
| 72 | Tonbridge and MallingKent | 28.0 | 16.9% | 43.1% | 7.3% | 12.5% | 2.5% | 1.0% | 208.2 mm |
| 73 | ColchesterEssex | 27.8 | 13.0% | 40.0% | 8.6% | 21.5% | 2.9% | 1.1% | 145.9 mm |
| 74 | Three RiversHertfordshire | 27.7 | 7.1% | 49.0% | 7.5% | 13.4% | 3.5% | 0.9% | 197.4 mm |
| 75 | DacorumHertfordshire | 27.6 | 9.7% | 40.7% | 8.1% | 14.3% | 3.1% | 1.0% | 203.4 mm |
| 76 | BrentwoodEssex | 27.4 | 11.1% | 49.9% | 7.7% | 16.0% | 3.2% | 1.0% | 156.1 mm |
| 77 | East HertfordshireHertfordshire | 27.2 | 15.5% | 41.9% | 8.0% | 16.1% | 2.5% | 1.1% | 167.7 mm |
| 78 | BuckinghamshireBuckinghamshire | 26.9 | 11.6% | 44.1% | 7.5% | 15.7% | 3.2% | 0.9% | 186.0 mm |
| 79 | ElmbridgeSurrey | 26.7 | 14.0% | 47.2% | 6.8% | 17.5% | 2.6% | 0.9% | 177.8 mm |
| 80 | BroxbourneHertfordshire | 25.9 | 7.0% | 43.4% | 7.3% | 16.0% | 6.0% | 1.5% | 172.1 mm |
| 81 | DartfordKent | 23.3 | 13.6% | 33.2% | 7.3% | 18.1% | 5.6% | 1.4% | 160.9 mm |
| 82 | Welwyn HatfieldHertfordshire | 23.0 | 2.9% | 35.6% | 8.4% | 16.4% | 4.1% | 0.9% | 175.5 mm |
| 83 | ChelmsfordEssex | 22.4 | 7.7% | 43.1% | 7.5% | 15.5% | 2.7% | 1.2% | 151.3 mm |
| 84 | Surrey HeathSurrey | 22.0 | 8.2% | 45.9% | 5.8% | 15.4% | 2.5% | 0.7% | 196.5 mm |
| 85 | HarlowEssex | 21.8 | 1.4% | 36.8% | 7.8% | 15.4% | 7.8% | 1.1% | 160.2 mm |
| 86 | Central BedfordshireBedfordshire | 21.3 | 10.6% | 37.6% | 7.9% | 13.7% | 2.3% | 1.0% | 155.7 mm |
| 87 | StevenageHertfordshire | 20.6 | 1.9% | 39.9% | 7.3% | 15.0% | 4.8% | 0.9% | 168.5 mm |
| 88 | BasildonEssex | 20.3 | 1.1% | 46.8% | 7.0% | 14.2% | 4.5% | 1.1% | 147.2 mm |
| 89 | RochfordEssex | 18.9 | 4.7% | 49.6% | 7.1% | 10.7% | 2.0% | 0.8% | 137.2 mm |
| 90 | Milton KeynesBuckinghamshire | 18.0 | 5.7% | 30.6% | 6.4% | 20.9% | 5.4% | 1.1% | 163.6 mm |
| 91 | Bracknell ForestBerkshire | 16.1 | 4.0% | 35.7% | 5.8% | 15.7% | 3.1% | 0.9% | 184.1 mm |
| 92 | WokinghamBerkshire | 15.1 | 5.7% | 37.1% | 5.6% | 14.1% | 2.0% | 0.7% | 183.3 mm |
Highest and lowest risk in each county
| County (councils) | Highest risk | Lowest risk |
|---|---|---|
| Bedfordshire (3) | Luton, 52.5 | Central Bedfordshire, 21.3 |
| Essex (14) | Southend-on-Sea, 50.3 | Rochford, 18.9 |
| Hertfordshire (10) | Watford, 48.2 | Stevenage, 20.6 |
| Berkshire (6) | Reading, 48.1 | Wokingham, 15.1 |
| Kent (13) | Thanet, 48.0 | Dartford, 23.3 |
| Surrey (11) | Waverley, 37.0 | Surrey Heath, 22.0 |
| Buckinghamshire (2) | Buckinghamshire, 26.9 | Milton Keynes, 18.0 |
Awaab's Law: what renters can expect
Awaab's Law is named after Awaab Ishak, who died aged two in 2020 after long exposure to mould in his family's social housing flat in Rochdale.
For social housing in England it has applied since 27 October 2025. Landlords must investigate damp and mould that presents a significant risk of harm within 10 working days, send the tenant a written summary within 3 working days of finishing the investigation, and complete the safety work within 5 working days of it. Emergency hazards must be investigated and made safe within 24 hours.
A second phase for social housing is due on 30 November 2026, subject to Parliament, adding hazards such as excess cold and excess heat.
Private renters are not covered yet. The Renters' Rights Act 2025 allows Awaab's Law to be extended to private tenancies, and the government is consulting on how until 18 December 2026, with no start date set. Until then, private renters can ask their council to inspect under the Housing Health and Safety Rating System, where damp and mould is already a hazard.
Can air conditioning help with damp and condensation?
Fix the cause first. Leaks, broken gutters, failed render, rising damp and blocked extractor fans need a builder or a damp specialist, not an appliance. Ventilation comes next: extractor fans in kitchens and bathrooms, trickle vents open, lids on pans and clothes dried outside or in a vented dryer.
Where condensation is the problem, steady warmth helps. Condensation forms on surfaces colder than the air's dew point, usually windows and outside walls. A room kept steadily warm, instead of heated in short bursts, keeps those surfaces warmer, and warm air holds moisture as vapour until ventilation carries it away.
A heat pump air conditioner is one of the cheapest ways to give a room that steady background heat (see our winter heating costs). Most also have a dry mode, which takes moisture out of the air and drains it outside as water. Dry mode works best in mild, humid weather; in the depth of winter, steady heat does more of the work.
An air conditioner isn't ventilation: a wall-mounted split unit recirculates the room's own air and brings in no fresh air. It won't fix rising or penetrating damp, and mould that's already there needs cleaning or treating. If you rent, report damp to your landlord in writing.
More in our guide to condensation, damp and mould and the real cost of heating one room this winter.
How the index is made
We scored all 92 council areas: the 32 London boroughs, the City of London, and every council in Hertfordshire, Bedfordshire, Buckinghamshire, Berkshire, Surrey, Kent and Essex (59 councils). There are no official counts of damp homes by council, so the index measures the conditions the government's damp and mould guidance links to damp: older, colder and poorly insulated homes, homes people can't afford to heat, overcrowding, renting, and rain.
Each indicator is scaled from 0 for the lowest area in the index to 100 for the highest, then weighted as in the table below. The weighted total is the score out of 100. A score is relative: it compares these areas with each other, and a low score doesn't mean no damp.
Winter rainfall is the Met Office's 1991 to 2020 average for December to February, averaged over every 2 km grid square in the council. We looked for outdoor humidity by council too, but found no open source at that level, so rainfall carries the climate weight alone. Fuel poverty figures are modelled estimates, which DESNZ says should be used to compare areas, not to track small changes. EPC figures cover homes with a certificate, not every home, and the Census figures are from 2021.
Data fetched 2026-11-01. You can use the index freely with a credit and a link to this page.
| Indicator | Weight | Why it counts | Source |
|---|---|---|---|
| Homes built before 1919 | 20 | Most homes this old have solid walls rather than cavity walls, so their walls run colder and are slower to dry out. | Valuation Office Agency, Council Tax stock of properties, 31 March 2026 |
| Homes rated below EPC band C | 20 | Poorly insulated homes have colder walls and windows, where condensation forms. | ONS, Energy efficiency of housing, EPCs to March 2025 |
| Households in fuel poverty | 20 | Homes that can't afford to stay warm stay cold and damp for longer. | DESNZ, Sub-regional fuel poverty, 2024 data |
| Households renting privately | 15 | The English Housing Survey finds damp in 10% of private rented homes, against 4% of owner-occupied ones. | ONS, Census 2021, TS054 |
| Households short of at least one bedroom | 10 | More people in less space means more moisture from breathing, cooking, washing and drying clothes. | ONS, Census 2021, TS052 |
| Households with no central heating | 5 | Rooms heated only now and then cool down between uses and collect condensation. | ONS, Census 2021, TS046 |
| Average winter rainfall, December to February | 10 | Rain getting through defects in walls and roofs causes penetrating damp. | Met Office HadUK-Grid, 1991 to 2020 averages (2 km grid) |
- DESNZ: Sub-regional fuel poverty, 2026 report (2024 data)
- ONS: Energy efficiency of housing, EPC band C or above by local authority
- VOA: Council Tax stock of properties 2026 (build period)
- ONS: Census 2021 tables TS054, TS052 and TS046 (Nomis)
- Met Office Climate Data Portal: monthly rainfall 1991 to 2020 (HadUK-Grid, 2 km)
- ONS: Local authority district boundaries, December 2024
- English Housing Survey 2024 to 2025: housing quality (damp)
- UKHSA and MHCLG: Damp and mould, understanding and addressing the health risks
- Coroner's Prevention of Future Deaths report: Awaab Ishak (2022)
- MHCLG: Awaab's Law, timeframes for repairs in the social rented sector
- MHCLG: Extending Awaab's Law to private rented tenancies (consultation)
Download the data and charts
Every area, score and indicator (CSV). The charts below are 1200 pixels wide and free to reuse.
If you use these figures or charts, please credit Westbridge Air and link to this page. Data released under CC BY 4.0. Journalists: email info@westbridgeair.co.uk or call 020 3411 1239 for local figures or a comment.
Cold, damp rooms every winter?
Once leaks and ventilation are sorted, steady background heat is what keeps condensation away. A wall-mounted heat pump unit does that for a fraction of the cost of a plug-in heater. We survey and fit across London and the Home Counties.
Damp and mould questions
Which London borough has the worst damp and mould risk?
Kensington and Chelsea, on our index, followed by Haringey and Westminster. The score reflects old housing, energy ratings, fuel poverty, private renting and overcrowding, not a count of damp homes.
Where is damp and mould risk lowest?
Wokingham scores lowest of the 92 areas, followed by Bracknell Forest and Milton Keynes: newer homes, better energy ratings and fewer households renting or short of space.
How common is damp in English homes?
The English Housing Survey found 1.4 million homes (5%) had a damp problem in 2024: 10% of private rented homes, 7% of social rented and 4% of owner-occupied. Severe condensation was the most common kind.
Does Awaab's Law apply to private renters?
Not yet. It has applied to social housing since 27 October 2025. The Renters' Rights Act 2025 lets the government extend it to private tenancies; a consultation on how runs until 18 December 2026, and no start date has been set.
Does air conditioning help with damp?
It can help with condensation, by giving cheap, steady background heat and by taking moisture out of the air in dry mode. It won't fix leaks, rising damp or poor ventilation, which come first.