Press: free data on heating costs, damp and London heat
Three data studies you can use for free with a link: the real cost of heating one room this winter at the Ofgem price cap, the Damp and Mould Risk Index for every London borough and Home Counties council, and London's hottest boroughs. Every figure links to its source, and each study has a CSV and charts to download.
plug-in heater, bedroom, per winter £443
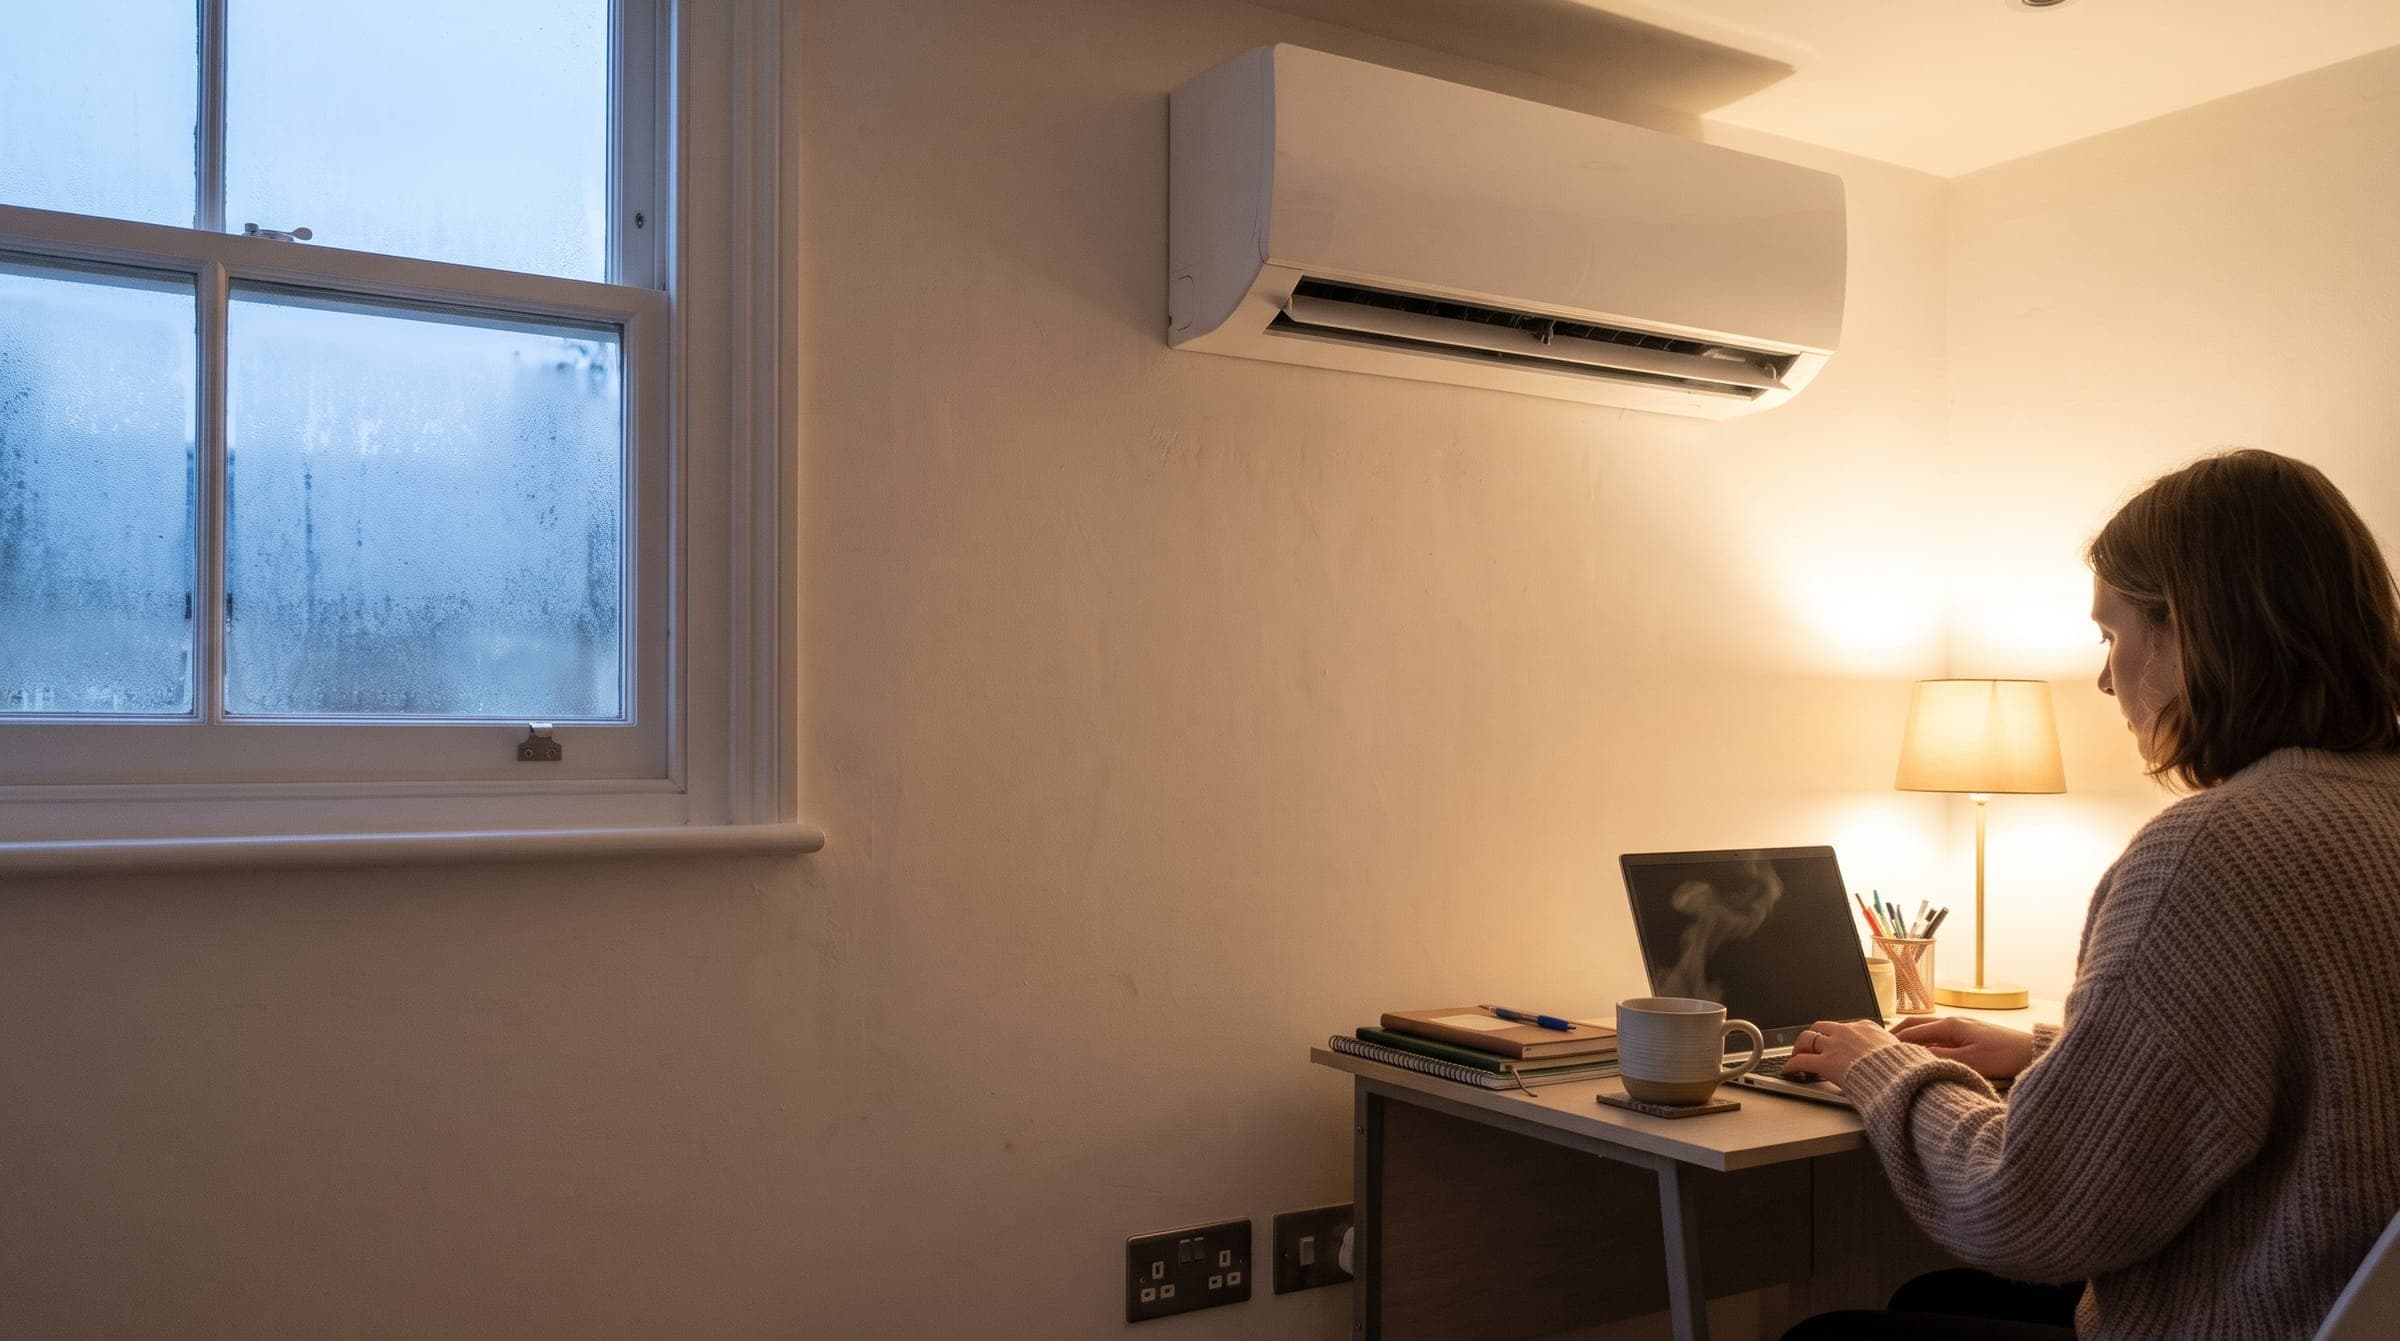
- plug-in heater, bedroom, per winter
- £443
- same warmth from air con in heat mode
- £127
- highest damp and mould risk of 92 areas
- Kensington and Chelsea
- hottest small area, London Fields
- 19.4°C
Winter study: the real cost of heating one room
Heating a bedroom overnight with a plug-in electric heater costs about £443 this winter at the Ofgem price cap, against £127 with a wall-mounted air conditioner in heat mode on cautious figures. A home office costs about £263 with a fan heater and £75 with air conditioning.
Eight heating methods in three scenarios, worked out hour by hour from ten winters of real temperatures, with each energy region's own cap rates. Full method, interactive table, CSV and charts: the real cost of heating one room this winter.
Winter study: the Damp and Mould Risk Index
Kensington and Chelsea, Haringey and Westminster have the highest damp and mould risk of the 92 council areas in London and the Home Counties, on an index built from seven open measures: old housing, energy ratings, fuel poverty, private renting, overcrowding, homes without central heating and winter rainfall.
Every area's rank, a map, the weightings in full and a note on Awaab's Law: the Damp and Mould Risk Index. Local figures for every county and borough are available on request.
Summer story: the London Overheating Index
We ranked all 33 London boroughs and 4,835 small areas by average summer air temperature near the ground, 2018 to 2022, from the Greater London Authority's London Climate Risk Maps. Westminster is the hottest borough at 18.29°C, then Tower Hamlets and Hackney. Bromley is the coolest at 17.90°C, against a London average of 18.06°C.
The single hottest small area is around London Fields in Hackney, at 19.4°C. Some of the next hottest are a surprise: areas around Hanwell, Pitshanger and Hanger Hill in Ealing, Twickenham Riverside and South Richmond, and Canary Wharf. The full ranking and map are on the London Overheating Index.
- The hottest tenth of small areas has 16.9% tree cover; the coolest tenth has 22.8%
- The hottest tenth has 26.9% social renters, against 19.1% in the coolest tenth
- Nitrogen dioxide averages 33.5 µg/m³ in the hottest tenth and 27.7 in the coolest
- In the ten hottest boroughs, 79 in 100 households live in flats; in the ten coolest, 42 in 100
How to use this data
You're welcome to use any figure, table or chart on this page, the index or the heating guide in print, online or on air, with a credit to Westbridge Air and a link where you can. The GLA data is published under the Open Government Licence v3.
We're London air conditioning engineers, and we can comment on keeping homes and businesses cool, the cheaper steps that come before air conditioning, and heating with a heat pump. Email info@westbridgeair.co.uk with your deadline and we'll reply quickly.
Questions from journalists
Can I use the figures without asking first?
Yes. Use any figure, table or chart from this page or the three studies, with a credit and a link where you can. You don't need to ask, though we're glad to check a figure for you before you publish.
Is the summer temperature the air or the ground surface?
It's the average summer air temperature near the ground for 2018 to 2022, modelled for each small area (LSOA) in the GLA's London Climate Risk Maps. Borough figures are the average of their small areas. Neighbourhood names are the nearest place to each small area's centre.
Does every air conditioner heat?
Nearly every split system sold for UK homes is a heat pump that heats as well as cools: the remote has a heat mode, usually a sun symbol. Most portable air conditioners only cool. If you're not sure, the model's datasheet lists a heating capacity and a SCOP.
Why leave out standing charges?
You pay the electricity standing charge whatever heats your home, and the gas one too if you keep gas for cooking or hot water. They don't change which heater is cheaper to run, so the heating study uses unit rates only.